Latest Subscriber Emails
April is the final month of the “Best Six Months” for DJIA and the S&P 500. The window for our seasonal MACD sell signal opens on April 3, the first trading day of the month this year. From our Seasonal MACD Buy Signal on October 4, 2022, through today’s close, DJIA is up 5.90% and S&P 500 is up 4.16%. This is below historical average performance due largely to persistent inflation, a tightening Fed, regional bank uncertainties and Russia’s ongoing invasion of Ukraine. But before the “Worst Months” arrive, April’s solid historical track record could help reignite the market.
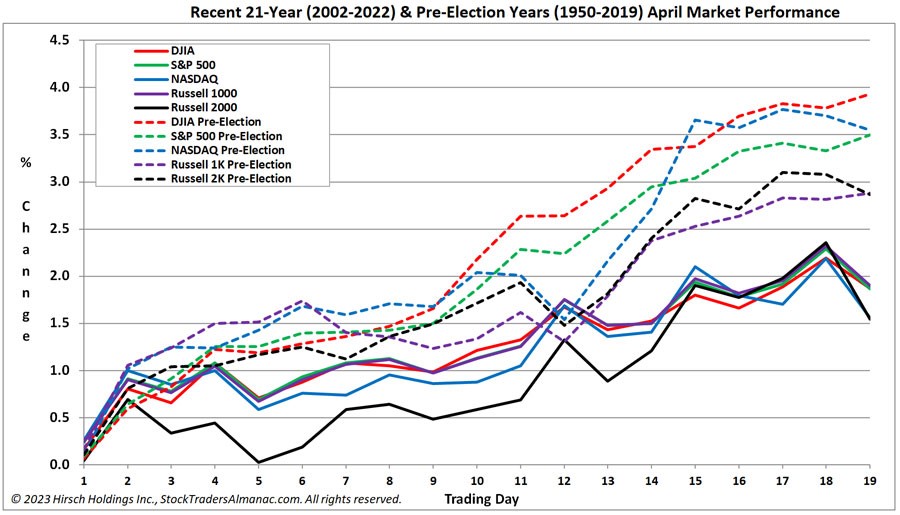
As you can see in the above chart of the recent 21-year market performance in April and pre-election years since 1950, the month has been nearly perfect with gains steadily building from the first trading day to the last with only the occasional and minor blip along the way. April 1999 was the first month ever to gain 1000 DJIA points. However, from 2000 to 2005, “Tax” month was hit, declining in four of six years. From 2006 through 2021, April was up sixteen years in a row with an average gain of 2.9% to reclaim its position as the best DJIA month since 1950. DJIA’s streak of April gains ended in 2022’s bear market. April is now the second-best month for S&P 500 and fourth best for NASDAQ (since 1971).
The first trading day of April and the second quarter, has enjoyed notable strength over the past 28 years, advancing 20 times with an average gain of 0.29% in all 28 years for DJIA. However, five of the eight declines have occurred in the last ten years. The largest decline was in 2020 when DJIA declined 4.44% (973.65 points). Other declines were in 2001, 2002 and 2005. S&P 500’s record on April’s first trading day matches DJIA, 20 advances in 28 years. NASDAQ’s recent performance is slightly weaker than DJIA and S&P 500, but the day is still bullish for technology stocks in general with more advances than declines during the same period. April’s second trading day has also been notably strong over the past 21 years.
This is the Q1 chop we forecasted. However, with the Dow’s December Low (2023 STA p 36) being breached, banking sector woes, government, and Wall Street fearmongering, as well as heightened geopolitical tensions with Russia and China we are adjusting our 2023 forecast and outlook back to our original base case scenario, which is still bullish: “Slightly below average pre-election year gains of 10-15%.”
As we see the plunge protection teams stepping up here in the U.S. and overseas and the public commitments from the powers that to backstop these poorly managed and capitalized regional and niche banks, we believe the fallout will be contained, the contagion prevented, and a banking crisis averted.
Looking back through the annals of bank crises since the Panic of 1907, the current banking woes pale in comparison in relative economic impact as a percent of GDP. Even the most recent comparison of SVB’s $209 billion in assets failure and second only to Washington Mutual’s $307 billion asset failure in September 2008 is misleading.
Based upon Sector Seasonality found on page 94 of the Stock Trader’s Almanac 2023, there is one new sector seasonality that begins in April: Computer Tech. Over the last 25 years, Computer Tech has gained an average of 11.6% from around the middle of April until around mid-July. This year we did not close out the position established for this sector back in October in early January. Instead, we held through its historically weak seasonality that normally ends in early March.
With over $43 billion in assets and ample average daily trading volume, SPDR Technology (XLK) remains our top choice to consider holding during Computer Tech’s seasonally favorable period. It has a gross expense ratio of just 0.10%. Top five holdings include: Apple, Microsoft, NVDIA, VISA and Mastercard. Please note, Apple and Microsoft combined account for 43.38% of XLK’s holdings as of March 1 close.
Market at a Glance
2/23/2023: Dow 33153.91 | S&P 4012.32 | NASDAQ 11590.40 | Russell 2K 1908.09 | NYSE 15584.92 | Value Line Arith 9286.65
Seasonal
Bullish. March has been a solid performer, ranking #5 for DJIA and S&P 500 since 1950. In pre-election years March has been even stronger ranking #4 for DJIA, S&P 500 and NASDAQ. Average pre-election year gains range from 1.8% by DJIA to 3.1% from NASDAQ. Week after quarterly options expiration and last three or four trading days have been the weak parts of the month.